

Imagine pulling up to a highway toll booth in a sports car. The engine is powerful, and the driver is ready, but the toll gate takes 10 seconds to lift. No matter how fast the car can physically go, its speed is capped by the gate blocking its path.
That toll gate is your website’s frontend code execution.
In my last guide on Core Web Vitals & SEO, we explored how Google measures real-user experience metrics like LCP, INP, and CLS. But measuring performance is only half the battle. To actually pass those metrics and rank at the top of organic search, you must optimize the mechanical layer underneath: how browsers parse HTML, execute JavaScript, render CSS, and download media assets.
In this complete technical guide, we will break down the exact asset compression, code execution, and browser rendering workflows required to build a lightning-fast web architecture that satisfies both Googlebot and real human visitors.
Why Page Speed Matters: Rendering Mechanics & Search Crawling
Difference between Page Speed vs. Core Web Vitals
Before optimizing a single line of code, we must clarify a fundamental distinction:
- Core Web Vitals: The scorecards (LCP, INP, CLS) that tell you whether users are experiencing a fast, stable page.
- Page Speed: The actual frontend engineering, asset optimization, and rendering pipelines that determine whether your scores pass or fail.
Critical Rendering Path (CRP) Explained
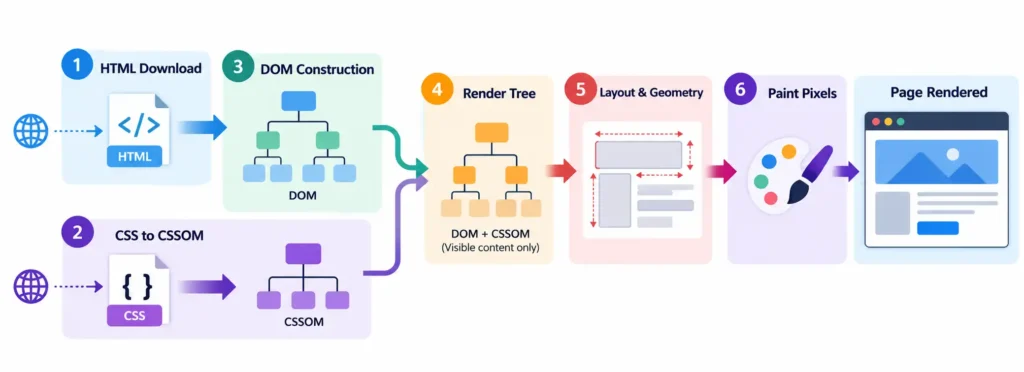
To understand page speed, you must understand the Critical Rendering Path (CRP), the sequence of steps the browser takes to convert HTML, CSS, and JavaScript into actual pixels on a screen:
[ HTML Download ] ──► [ DOM Construction ] ──► [ Render Tree ] ──► [ Layout & Geometry ] ──► [ Paint Pixels ]
- HTML to DOM: The browser downloads the HTML and builds the Document Object Model (the structural tree of elements).
- CSS to CSSOM: Simultaneously, the browser parses stylesheets to build the CSS Object Model (styling rules).
- Render Tree Creation: The DOM and CSSOM combine to form the Render Tree, containing only the visible content needed to display the page.
- Layout (Reflow): The browser calculates the exact geometric coordinates and sizes for every element on the screen.
- Paint: Finally, the browser paints the pixels onto the user’s screen.
Any render-blocking script or oversized stylesheet injected into this path delays every single step, destroying your page speed.
How Slow Loading Times Destroy Crawl Budget Efficiency & Conversion Rates
Optimizing page speed is not just a technical SEO exercise; it is a direct revenue and indexation driver:
- Crawl Budget Efficiency: Fast pages respond in milliseconds, allowing Googlebot to crawl significantly more pages per session without hitting connection timeouts. Slow sites waste crawl budget as Googlebot aborts requests.
- Conversion Rate Lift: Industry benchmarks show that every 100ms delay in page load time reduces conversion rates by up to 1%.
- Bounce Rate Reduction: As page load times increase from 1 second to 3 seconds, the probability of a mobile user bouncing increases by 32%.
Image Optimization Pipeline: Compression, Modern Formats & Responsive Syntax
On an average web page, media assets (images, videos, and custom fonts) account for over 60% of total page weight. You can write clean, compressed JavaScript, but if your landing page loads a raw 5MB JPEG banner, your page speed will immediately collapse.
Optimizing assets is the highest-leverage performance win for any website.
Lossy vs. Lossless Compression
When reducing image file sizes, you must choose between two compression techniques:
- Lossless Compression: Reduces file size by eliminating unnecessary metadata (such as camera EXIF data and color profiles) without altering a single pixel. Image quality remains 100% identical, but file size savings are modest (typically 10%–20%).
- Lossy Compression: Permanently removes imperceptible visual data. When configured correctly (aiming for an 80%–85% quality threshold), it slashes file sizes by 60%–80% with zero noticeable loss in visual quality to the human eye.
Modern Next-Gen Image Formats (WebP & AVIF)
Legacy formats like JPEG and PNG are mechanically inefficient for the modern web. You should convert all raster images to next-gen formats:
Responsive Images (srcset and <picture> Elements)
Serving a 2560px desktop banner image to a mobile phone on a 3G network wastes bandwidth. Use responsive syntax so the browser requests the exact dimensions needed for the user’s screen size:
- The
srcsetattribute: Supplies a list of image source files alongside their actual pixel widths:
<img src="hero-800.webp"
     srcset="hero-400.webp 400w, hero-800.webp 800w, hero-1200.webp 1200w"
     sizes="(max-width: 600px) 400px, 800px"
     alt="E-commerce Product Banner">
- The
<picture>tag: Use this when you need art direction (e.g., serving a cropped vertical image on mobile and a wide horizontal image on desktop) or format fallbacks.
Native Lazy Loading vs. Above-the-Fold Preloading
The Native loading="lazy" Attribute
Adding loading="lazy" tells the browser to defer downloading the image until the user scrolls within a set distance of it.
- Where to use it: Below-the-fold content, blog post body images, footer logos, and related product grids.
- The Performance Win: Saves massive initial bandwidth and clears the network queue for critical code execution.
The Above-the-Fold Priority Rule (LCP Protection)
CRITICAL ERROR: Never apply
loading="lazy"to your top hero image or main product graphic.
Lazy loading your hero image adds a artificial execution delay, causing your LCP score to spike into the red zone. Instead, enforce immediate fetch priority on your above-the-fold hero image:
<link rel="preload" fetchpriority="high" as="image" href="hero-banner.avif" type="image/avif">
Video & Heavy Media Handling: Deferring Non-Critical Media
Embedded videos (especially YouTube or Vimeo iframes) carry heavy JavaScript execution overhead, often pulling down 1MB+ of external scripts before a user even clicks play.
Optimization Execution Steps:
- Replace Iframes with Facades (Lazy Frames): Render a lightweight static thumbnail image with a fake CSS play button first. Load the heavy third-party video iframe only when the user clicks the play button.
- Autoplay Video Rules: For background loop videos, strip the audio track completely, use compressed MP4/WebM containers, and add the
muted,playsinline, andautoplayattributes to prevent browser execution blocks.
Font Delivery Optimization: WOFF2, Font Subsetting & font-display
Custom Google Fonts or Adobe Fonts can silently block text rendering and trigger heavy layout shifts (CLS) if delivered incorrectly.
The Font Optimization Checklist:
- Adopt WOFF2 Exclusively: WOFF2 offers superior custom preprocessing compression (roughly 30% smaller than legacy WOFF).
- Font Subsetting: Remove unused character sets (e.g., Latin-ext, Cyrillic, Greek) if your content is strictly written in US English. Subsetting can shrink a font file from 100KB down to 15KB.
- Prevent FOIT & FOUT with
font-display: swap: Instruct the browser to display a fallback system font immediately while your custom font downloads, swapping it seamlessly once ready:
@font-face {
  font-family: 'CustomFont';
  src: url('/fonts/custom-font.woff2') format('woff2');
  font-display: swap;
}
Code Optimization (JavaScript & CSS Execution)
Even after optimizing your images and media files, your website can still crawl to a halt if the browser is forced to process bloated, unoptimized stylesheets and massive JavaScript bundles.
When a browser encounters a stylesheet or script in the HTML document, it must pause DOM construction to download, parse, and execute that code. Managing how code is delivered is critical to unlocking lightning-fast page execution.
Eliminating Render-Blocking Resources & Code Bloat
CSS Optimization: Minification, Unused CSS Removal, and Critical CSS Extraction
Stylesheets are render-blocking by default, meaning the browser will not display a single pixel of content until all external CSS files have been fully downloaded and parsed.
- Minification: Strip out all whitespace, comments, and long variable names from your production CSS files to reduce file size.
- Unused CSS Removal: Large frameworks (like Bootstrap or bloated theme stylesheets) often ship thousands of styling rules that your specific page never uses. Automated build tools scan your HTML templates and strip out any dead CSS selectors.
- Critical CSS Extraction: Extract the minimal CSS required to render above-the-fold content and inline it directly into the
<head>of your HTML document. The remaining stylesheets are then loaded asynchronously, allowing the browser to paint the top of the page instantly without waiting for full CSS downloads.
JavaScript Execution: async vs. defer Loading Attributes
By default, when the browser hits a <script> tag in the HTML, it halts HTML parsing entirely to download and execute the script. To prevent this blocking behavior, you must use modern loading attributes:
async(Asynchronous): Downloads the script in the background while HTML parsing continues. Once downloaded, HTML parsing pauses immediately to execute the script. Best for independent scripts like analytics trackers where execution order does not matter.defer(Deferred): Downloads the script in the background while HTML parsing continues, but waits to execute until the entire HTML document has been fully parsed. This is the safest and most efficient attribute for core frontend JavaScript files because it guarantees scripts execute in their correct relative order without blocking DOM construction.
Modern JS Management: Code Splitting, Tree-Shaking, and Deferring Non-Essential Scripts
- Code Splitting: Instead of bundling your entire application’s JavaScript into one massive monolithic file, modern bundlers (like Webpack or Vite) split code into smaller, route-specific chunks. The browser only downloads the JavaScript required for the specific page the user is currently viewing.
- Tree-Shaking: A dead-code elimination technique used during the build process to strip out unused functions and modules from imported libraries.
- Deferring Non-Essential Scripts: Push marketing pixels, live chat widgets, and social media embeds out of the critical path. Load them dynamically only after the page has finished loading or when the user initiates a scroll event.
Web Font Performance: font-display: swap, Local Hosting vs. Google Fonts, and Subset Optimization
Custom typography can drastically enhance your brand design, but unoptimized web fonts trigger rendering delays and layout shifts.
font-display: swap: Instructs the browser to render fallback system text immediately while the custom font file downloads in the background, swapping it seamlessly once ready (preventing invisible text flashes).- Local Hosting vs. Google Fonts: Relying on external third-party requests to Google Fonts introduces extra DNS lookups and SSL handshakes. Hosting your font files locally on your own server or CDN removes external connection overhead.
- Font Subsetting: Strip out unnecessary character glyphs (such as Cyrillic, Greek, or unused weight variants) if your site serves a specific audience, shrinking font payload sizes from 100KB down to under 15KB.
Server-to-Browser Delivery Optimization: Data Delivery, Compression & Caching Layer
Writing clean code and optimizing your image assets is only half the battle. Once your frontend files are ready, they must travel across the internet from your server (or CDN edge) to the user’s browser.
If your transport layer is unoptimized, even lightweight files will crawl over high-latency networks. Managing how data is compressed, cached, and transmitted over modern transport protocols is what separates a sluggish site from an instantaneous one.
Server-to-Browser Delivery Optimization
Text Compression Protocols: Gzip vs. Brotli Algorithm Performance
Before text-based assets (HTML, CSS, JavaScript, and SVG files) are transmitted over the network, they should be compressed on the server to dramatically reduce payload size.
- Gzip: The traditional industry-standard compression algorithm. While widely supported across all legacy servers and browsers, Gzip offers moderate compression ratios.
- Brotli: Developed by Google, Brotli is a modern compression algorithm that utilizes a pre-computed dictionary and advanced data modeling. Brotli delivers text compression ratios 15% to 25% smaller than Gzip, significantly slashing transfer times for large JavaScript bundles and stylesheets. Always configure your server to negotiate Brotli for supported modern browsers, falling back to Gzip only when necessary.
Browser Caching Rules (Leveraging Cache-Control Headers & Expiry Tokens)
The fastest HTTP request is the one that never has to be made. By implementing robust browser caching policies, you instruct repeat visitors’ browsers to store static assets locally so they don’t have to re-download them on subsequent page views.
- The
Cache-ControlHeader: The modern standard for defining caching behavior. Using directives likeCache-Control: public, max-age=31536000, immutabletells the browser that static assets (like versioned images, fonts, and compiled CSS/JS bundles) can be safely cached for a full year without needing revalidation. - Cache Busting via File Versioning: When you update a cached stylesheet or script, how does the browser know to fetch the new version? You append a unique content hash or version string to the filename (e.g.,
main.a3b8c2.js). When the filename changes, the browser treats it as a fresh asset and downloads it immediately.
Content Delivery Networks (CDNs): Edge Caching, Anycast Routing, and Static Asset Offloading
Origin server distance introduces physical network latency. If your server is hosted in New York, a user visiting from London has to wait for data to travel across transatlantic cables.
- Edge Caching: CDNs cache your static assets (images, CSS, JS) across a global network of distributed proxy servers (edge nodes) located physically closer to your users.
- Anycast Routing: Automatically routes user requests to the geographically nearest CDN edge node, drastically reducing DNS lookup times and connection round-trips.
- Static Asset Offloading: By serving static media and assets directly from CDN edge nodes, you offload massive amounts of bandwidth and computing overhead away from your primary origin server.
HTTP Protocol Evolution: HTTP/1.1 Multiplexing Limitations vs. HTTP/2 and HTTP/3 (QUIC)
The transport protocol governing how data packets travel between browser and server has evolved dramatically:
- HTTP/1.1 Limitations: Under HTTP/1.1, browsers faced strict connection limits per domain (typically 6 concurrent connections). If a page had 30 icons and scripts, requests had to queue up sequentially, causing severe head-of-line blocking.
- HTTP/2 Multiplexing: Introduced true multiplexing, allowing multiple concurrent requests and responses to flow simultaneously over a single TCP connection, eliminating resource queuing.
- HTTP/3 (QUIC Protocol): Replaces TCP with UDP-based QUIC transport. HTTP/3 eliminates TCP handshake delays and solves “transport-layer head-of-line blocking,” ensuring that if a single packet drops on a flaky mobile network, it doesn’t pause the delivery of other parallel asset streams.
Diagnostic Toolchain for Asset & Asset Performance
Knowing that your page is slow is only half the battle. To actually fix performance bottlenecks, you need a precise diagnostic toolchain that uncovers bloated files, unoptimized asset formats, render-blocking scripts, and inefficient network waterfalls.
While Article 1 focused on macro-level user experience reports (like Google Search Console and CrUX), this section dives deep into micro-level frontend auditing tools used by engineers to inspect asset weight and request timelines.
Auditing Page Speed & Uncovering Bottlenecks
PageSpeed Insights Asset Diagnostics
When you run a URL through PageSpeed Insights (PSI), the bottom half of the report contains two critical tabs that every frontend developer must inspect: Opportunities and Diagnostics.
- The Opportunities Tab: Acts as your automated cost-benefit analysis. It flags specific inefficiencies such as unoptimized images, render-blocking stylesheets, or unminified JavaScript, and estimates exact byte savings and time reductions (e.g., “Potential savings: 1.2s”).
- The Diagnostics Tab: Highlights structural code issues, such as massive DOM depth, excessive network payload sizes, or main-thread execution bottlenecks, giving you a clear developer checklist for remediation.
GTmetrix & WebPageTest (Waterfall Chart Analysis & Connection Timelines)
When automated scores aren’t enough, professional auditors turn to advanced waterfall analysis tools like GTmetrix and WebPageTest.
Understanding the Waterfall Chart: The network waterfall is a chronological, horizontal timeline showing every single asset request made by the browser (HTML, CSS, JS, fonts, images). Each request bar breaks down into distinct phases:
- DNS Lookup & Initial Connection: Time spent resolving domains and handshaking.
- Waiting (TTFB): Server response time.
- Downloading: The actual time taken to transfer asset bytes across the wire.
Spotting Bottlenecks in the Waterfall: By inspecting waterfall charts, you can instantly spot long red bars indicating stalled requests, massive JavaScript files blocking downstream rendering, or uncompressed images dragging down total load time.
Chrome DevTools Coverage & Network Tabs (Finding Unused Bytes)
For local debugging during development, nothing beats native Chrome DevTools:
- The Network Tab: Allows you to simulate different network throttling speeds (e.g., Slow 3G or Fast 4G), inspect individual response headers (
Cache-Control,Content-Encoding), and verify whether assets are being served via Brotli compression or loaded from browser cache. - The Coverage Tab: A powerful built-in tool that records your page load and scans your JavaScript and CSS files in real time. It highlights exactly how many bytes are unused (often revealing that a heavy plugin is shipping 80% dead code), allowing engineers to trim code bloat with surgical precision.
CMS & Framework Implementation Pathways
Understanding the mechanics of minification, compression, and delivery is essential, but the actual implementation of these rules depends entirely on your website’s underlying architecture. You cannot optimize a headless React application the same way you optimize a monolithic WordPress theme.
To bridge the gap between performance theory and engineering execution, here are the targeted playbooks for optimizing frontend assets across the three most dominant web stacks.
Pagespeed Optimization Across Popular Website Platforms
WordPress Optimization:
WordPress powers over 40% of the web, but its plugin ecosystem is notorious for injecting bloated, unused CSS and JavaScript across every single page.
- Asset Management (Script Unloading): Use asset managers like Perfmatters to selectively dequeue scripts and stylesheets on a per-page basis. If your “Contact Form” plugin loads its heavy JavaScript bundle on your homepage, use the script manager to disable it everywhere except the actual
/contact/URL. - Advanced Caching Plugins (WP Rocket): Deploy enterprise-grade caching tools like WP Rocket to automate HTML/CSS/JS minification. More importantly, utilize its “Delay JavaScript Execution” feature to hold third-party scripts (like Facebook Pixels or Chat widgets) until the user interacts with the page, instantly freeing up the critical rendering path.
- Database Cleaning for Frontend Speed: Over time, WordPress databases bloat with post revisions, expired transients, and orphaned plugin tables. While strictly a backend database issue, this bloat forces WordPress to run heavier queries to generate the HTML document, increasing the total byte size of the initial payload. Regularly sweep your database to ensure the HTML document is generated and delivered as leanly as possible.
Shopify / E-Commerce Optimization:
In the Shopify ecosystem, store owners do not control the backend servers. Performance optimization is 100% reliant on frontend Liquid theme architecture and third-party app management.
- Theme Asset Reduction: Modern Shopify themes (like “Dawn” and Online Store 2.0 architectures) use modular CSS and JS. However, older themes load a single, massive
theme.scss.liquidfile. Audit your theme files and remove legacy CSS rules for features you no longer use. - App Script Deferment: The biggest speed killer on Shopify is third-party apps injecting synchronous scripts into the
<head>. Audit yourtheme.liquidfile to identify app scripts. Move non-critical scripts before the closing</body>tag or wrap them in deferred loading logic so they don’t block product image rendering. - Media Delivery (Liquid Filters): Leverage Shopify’s native CDN by using Liquid image filters. Never hardcode an image URL. Instead, use filters like
{{ product.featured_image | image_url: width: 800, format: 'avif' }}to ensure Shopify automatically converts images to AVIF/WebP and serves them at the exact responsive dimensions required.
Custom / Modern JS Frameworks (Next.js / React):
For enterprise applications built on headless architectures like Next.js, performance optimization relies on controlling the JavaScript bundle size shipped to the client.
- Dynamic Imports (
next/dynamic): By default, React components are bundled together. Use dynamic imports to code-split heavy, non-critical components (like a complex interactive chart or a modal window) so the browser only downloads that specific JavaScript chunk when the user actually triggers the component. - Compiler Optimizations: Leverage modern JavaScript compilers like SWC (the default in Next.js). SWC strips out dead code, minifies bundles, and optimizes AST (Abstract Syntax Trees) significantly faster and more efficiently than legacy bundlers like Webpack or Terser.
- Edge Bundling & Route-Based Splitting: Modern frameworks automatically split JavaScript bundles by route. Ensure your architecture is strictly adhering to this. A user visiting
/aboutshould download zero bytes of JavaScript intended for the/checkoutroute.
Performance Regression Testing & Maintenance
Achieving a lightning-fast page speed score is a great milestone, but keeping it green permanently is an ongoing operational commitment. Websites are living ecosystems: developers push new code daily, marketing teams launch tracking scripts, and e-commerce managers add high-res banner images. Without rigorous regression testing, your site’s performance will inevitably degrade over time.
In this final section, we explore how to embed performance guardrails into your development workflows, wrap up our deep dive into asset optimization, and answer the most critical high-volume search questions regarding page speed engineering.
Maintaining Performance Standards Across Site Updates
Setting Performance Budgets (Max KB Limits for JS/CSS/Images)
To stop performance regression before it hits your live server, you must establish strict Performance Budgets. A performance budget sets a hard limit on the physical file size or loading time of your assets.
Defining Limits: Set clear byte constraints for your build pipelines for example:
- JavaScript Bundles: Max 150KB (uncompressed) / 50KB (gzipped).
- Critical CSS: Max 14KB (to fit within initial TCP slow-start packets).
- Hero Images / Assets: Max 100KB per optimized AVIF file.
Enforcing Compliance: If a developer attempts to merge a pull request that introduces a massive unoptimized image or a bloated third-party library that breaches these limits, the build should fail automatically.
CI/CD Performance Testing
Performance shouldn’t be audited manually once a quarter; it should be tested automatically with every single code deployment.
- Lighthouse CI Integration: Integrate automated performance tools like Lighthouse CI into your GitHub Actions or GitLab CI/CD pipelines.
- Automated Pull Request Audits: Every time code is pushed to a staging branch, Lighthouse CI runs an automated audit against the modified pages. If the performance score drops below your threshold (e.g., falling below 90) or asset sizes spike, the deployment is blocked until the code is optimized.
Conclusion
Page speed optimization is not a one-time audit task, it is an ongoing engineering discipline. By mastering the Critical Rendering Path, compressing your image pipelines, minifying code execution, and enforcing strict caching and CI/CD budgets, you ensure that your website delivers an instantaneous experience for both users and search engine crawlers.
Need a Professional Page Speed & Technical SEO Audit?
If your website is bogged down by bloated JavaScript bundles, slow image pipelines, or poor rendering metrics, I can help. Explore my Technical SEO Services & Mobile SEO Services, or Contact me for technical SEO practice for a comprehensive architecture and frontend performance audit tailored to your stack.
Frequently Asked Questions
What is page speed optimization?
Page speed optimization is the practice of tuning and streamlining a website’s frontend code, server response mechanics, and media assets so that web pages load, parse, and render on a user’s screen as fast as possible. This involves compressing images (into WebP/AVIF), minifying CSS and JavaScript, leveraging browser caching, and eliminating render-blocking resources.
How to increase mobile page speed?
To increase mobile page speed, you must reduce mobile network overhead and CPU processing constraints:
- Optimize Media: Serve responsive images using
srcsetand enforce native lazy loading (loading="lazy") for all below-the-fold elements. - Defer Non-Critical JS: Push heavy third-party tracking scripts and widgets out of the critical path using
deferor dynamic loading. - Streamline CSS: Extract critical above-the-fold CSS inline and load remaining stylesheets asynchronously.
How important is page speed for websites?
Page speed is critically important for both user retention and organic search rankings. Studies show that a 1-second delay in page load time can drop conversions by up to 7% and increase mobile bounce rates by 32%. From an SEO perspective, Google evaluates speed metrics as part of its page experience guidelines, making fast performance a vital competitive tie-breaker.
What is considered a “good” page speed?
While individual metrics vary, a high-performing website generally achieves:
- Largest Contentful Paint (LCP): Under 2.5 seconds.
- Total Page Weight: Under 1.5 MB for mobile viewports.
- Initial JavaScript Payload: Under 150KB–200KB uncompressed to prevent mobile CPU throttling.
- PageSpeed Insights Score: A score of 90 to 100 on mobile and desktop diagnostics.
How to test and measure page load speed?
You can test page load speed using a combination of lab and field diagnostic tools:
- Synthetic Testing (Lab Data): Use PageSpeed Insights (PSI), GTmetrix, or WebPageTest to inspect network waterfall charts, code coverage, and asset weights under simulated conditions.
- Real-User Monitoring (Field Data): Check the Google Search Console (GSC) Core Web Vitals report to view actual 28-day user telemetry from the Chrome User Experience Report (CrUX).
Can you check page speed in Google Analytics (GA4)?
Google Analytics 4 (GA4) does not track server-side asset weight or code performance directly, but you can track user engagement metrics tied to speed. You can analyze User Engagement Time, Bounce Rate, and custom event timings across different device categories to see how slow-loading mobile sessions impact user behavior compared to fast desktop sessions.
What is the difference between WebP and AVIF image formats?
AVIF (AV1 Image File Format) offers superior compression, delivering file sizes up to 50% smaller than JPEG while preserving high dynamic range (HDR) color profiles. WebP, on the other hand, has wider universal support across older legacy browsers and devices. For optimal performance, serve AVIF files to modern browsers using an HTML <picture> element with WebP as a fallback.
Is Brotli always better than Gzip for text compression?
Yes. Brotli consistently outperforms Gzip, delivering text compression ratios 15% to 25% smaller for text-based assets like CSS, JavaScript, and HTML files. Modern servers should be configured to negotiate Brotli by default for supported browsers, falling back to Gzip only for legacy user agents.
What is the ideal total page weight (in KB) for a fast-loading website?
While there is no strict rule, high-performing websites target a total initial page weight under 1.5 MB for mobile viewports. Furthermore, critical JavaScript payloads should be kept strictly under 150KB–200KB uncompressed to prevent mobile main-thread execution bottlenecks.
What is the difference between async and defer script loading?
async(Asynchronous): Downloads the script in the background while HTML parses, but pauses HTML parsing immediately to execute the script the moment download finishes. Best for independent tracking pixels where execution order doesn’t matter.defer(Deferred): Downloads the script in the background and waits to execute until the entire HTML document is fully parsed, preserving safe execution order for core frontend code.
Does minifying JavaScript and CSS actually improve SEO?
Yes, both directly and indirectly. Minification strips out unnecessary whitespace, comments, and long variables, drastically reducing file transfer weight. This accelerates network download times and speeds up DOM parsing, which directly improves performance metrics like LCP and overall site crawl efficiency.
Why do third-party scripts destroy page speed scores?
Third-party tools (such as live chat widgets, marketing pixels, and A/B testing scripts) load external JavaScript files outside of your direct control. They frequently trigger long tasks on the main thread and cause network congestion. They should always be deferred, loaded via web workers, or injected dynamically after initial user interaction.
Explore Other Articles Under Technical SEO Side
Pillar Blogs
What is Technical SEO? (Parent Blog)
- Core Web Vitals & Technical Performance (Child Blog)