
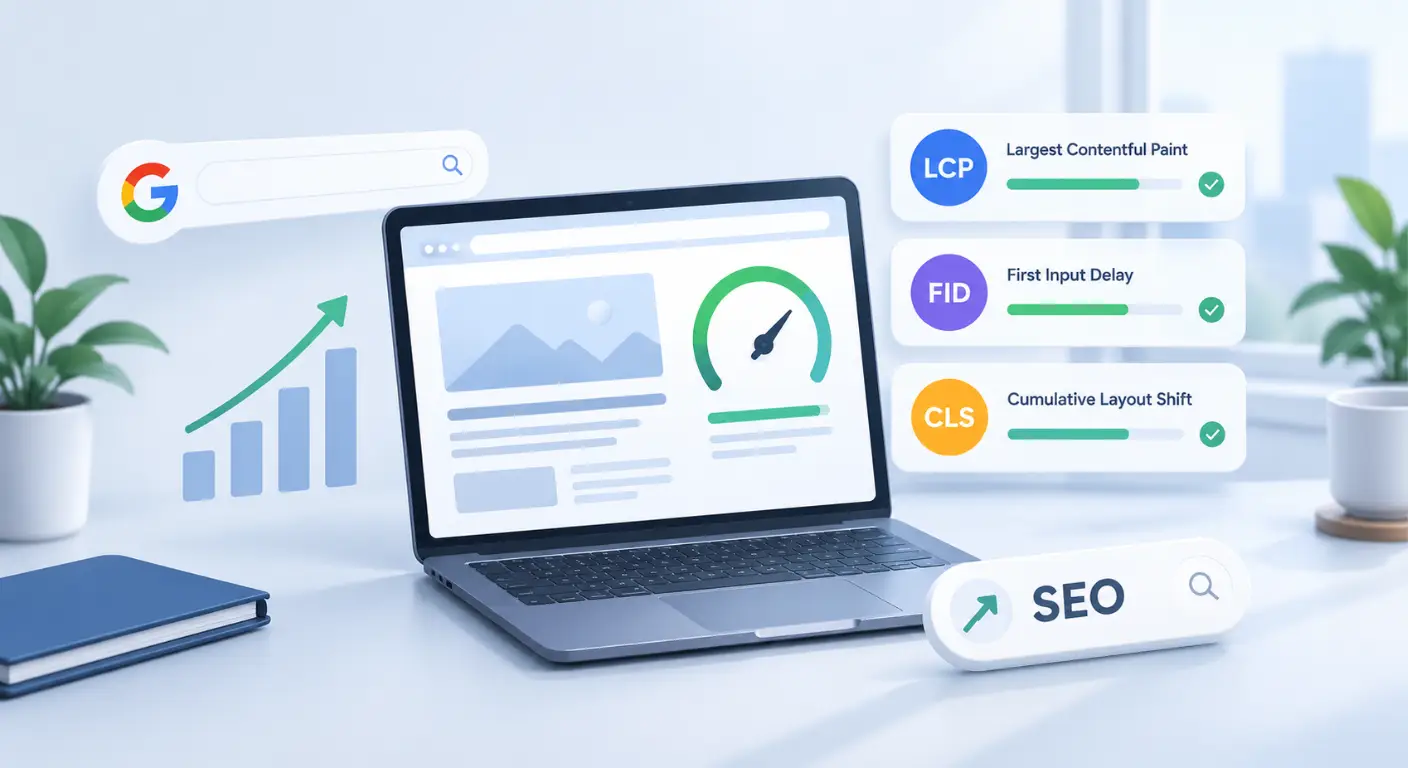
Imagine shopping online late at night. You click on a product link, but the page takes 5 seconds to load. When the content finally appears, you tap the “Buy Now” button. Only for a late-loading ad to suddenly pop up, causing your finger to register a click on the wrong link instead.
Frustrating, right? You would immediately hit the back button, return to Google, and buy from a competitor’s website instead.
Google notices this user behavior instantly. Years ago, Google primarily evaluated on-page keywords and text relevance to decide search rankings. Today, Google’s top priority is delivering a seamless, high-quality User Experience (UX). If your website is technically secure and indexed but frustrates real human visitors, Google will not reward you with top organic rankings.
This is where Core Web Vitals (CWV) come into play. In this guide, we will break down what these performance metrics are, why Google created them, how they directly impact your organic rankings, and how you can optimize them step-by-step.
What Are Core Web Vitals and Why Did Google Introduce Them?
From Page Speed to Real User Experience
Historically, webmasters and site owners measured performance purely through raw server speed, checking how fast a hosting server transferred raw data bandwidth over a network connection. However, a site can have a fast server and still feel slow, clunky, or unresponsive inside a browser.
Google realized that traditional speed tests only measured machine-level infrastructure. They failed to answer a fundamental question: How does an actual human being experience this page on a mobile screen?
This paradigm shift led to the creation of Core Web Vitals. These are not arbitrary technical scores; they are digital metrics designed to measure real human frustration. They evaluate how quickly main content loads onto the screen (Loading Speed), how fast a page responds when a user taps a button (Interactivity), and whether elements unexpectedly jump around during rendering (Visual Stability).
How Core Web Vitals Fit Into Google’s Page Experience System
Core Web Vitals do not operate in isolation. They form the primary technical pillar within Google’s broader Page Experience System.
Think of your website as a physical restaurant:
- High-Quality Content: The taste and quality of the food served (Traditional On-Page SEO & Topic Authority).
- HTTPS Security: The cleanliness and safety inspection of the dining area (HTTPS & SSL Encryption).
- Mobile Friendliness: Comfortable seating arrangements for all guests (Responsive Web Design).
- Core Web Vitals: How quickly the waiter delivers your meal without spilling food across the table (User Experience & Loading Signals).
When all these signals align, search engine algorithms can confidently rank your site at the top of organic search results.
Regarding HTTPS and SSL You can explore my dedicate guides here:
Are Core Web Vitals a Direct Ranking Factor? – The Truth About Thresholds
A common misconception among site owners is that achieving a perfect 100/100 performance score guarantees an immediate #1 spot on Google even with mediocre content. This is not how search indexing works.
Google treats Core Web Vitals primarily as a tie-breaker ranking signal:
- If two competing pages offer equally authoritative content, relevant backlink profiles, and strong search intent match, Google will rank the page with superior Core Web Vitals higher.
- Excellent performance scores cannot compensate for poor, unhelpful content. Relevance remains king.
- Conversely, failing Core Web Vitals thresholds (falling into the “Poor” category) increases bounce rates and user drop-offs, indirectly eroding organic rankings over time.
Core Web Vitals are not a magic ranking wand, they are the critical technical foundation that preserves your hard-earned organic traffic and maximizes user conversions.
Decoding The Big 3 Core Web Vitals Metrics (LCP, INP & CLS)
Now that we understand why Google measures user experience, let’s dive into the mechanics of the three metrics that make up Core Web Vitals: LCP, INP, and CLS.
Each metric evaluates a distinct phase of how a user interacts with a web page:
- Loading Speed (How fast does the main content appear?)
- Interactivity (How fast does the page react to user inputs?)
- Visual Stability (Does the page layout stay still while loading?)
Core Web Vitals Benchmarks at a Glance
Google categorizes each metric into three evaluation zones based on the 75th percentile (p75) of real-world user visits:
| Core Web Vital Metric | Target (Good) | Needs Improvement | Poor | Primary Focus Area |
| LCP (Largest Contentful Paint) | $\le$ 2.5 seconds | 2.5s – 4.0s | $> 4.0$ seconds | Visual Loading Speed |
| INP (Interaction to Next Paint) | $\le$ 200 milliseconds | 200ms – 500ms | $> 500$ milliseconds | Real-Time Responsiveness |
| CLS (Cumulative Layout Shift) | $\le$ 0.1 | 0.1 – 0.25 | $> 0.25$ | Visual Layout Stability |
Largest Contentful Paint (LCP): Measuring Visual Loading Speed
What is LCP?
Largest Contentful Paint (LCP) measures how long it takes for the largest visual element above the fold (the portion of the webpage visible on screen without scrolling) to fully render inside the viewport.
The LCP Benchmark Thresholds
- Good: $\le 2.5$ seconds (Target threshold)
- Needs Improvement: Between 2.5s and 4.0s
- Poor: $> 4.0$ seconds
Identifying the LCP Element
Unlike old speed metrics like onload or DOMContentLoaded (which measure when technical code finishes downloading), LCP focuses purely on what the user actually sees.
The LCP element is dynamically flagged by the browser as the page renders. It is almost always one of the following DOM (Document Object Model, the tree structure of HTML tags) elements:
- Featured Hero Image: The main banner image at the top of a blog post or landing page.
- Large Text Block: A prominent
<h1>main heading, paragraph, or styled blockquote. - Background Images: A CSS-rendered background image loaded via
url()containing text or visuals. - Poster Images for Video Elements: The static thumbnail image rendered before a
<video>plays.
High-Level Causes of Poor LCP
When a site fails LCP, the root cause usually boils down to one of four visual delivery delays:
- Slow Server Response Times (TTFB): The hosting server takes too long to deliver the initial HTML document.
- Render-Blocking JavaScript & CSS: The browser is forced to pause rendering while downloading heavy script files.
- Slow Resource Load Times: The main hero image file size is massive and uncompressed.
- Client-Side Rendering (CSR) Delays: Modern JavaScript frameworks (like React or Vue) rendering content on the client device rather than pre-rendering on the server.
Interaction to Next Paint (INP): Measuring Real-Time Responsiveness
What is INP?
Interaction to Next Paint (INP) measures your page’s overall responsiveness to user interactions. It tracks the time it takes from when a user taps, clicks, or presses a key until the browser presents the very next visual frame update on screen.
Why INP Replaced FID (First Input Delay)
In March 2024, Google officially replaced First Input Delay (FID) with INP.
Why the switch?
FID was incomplete: FID only measured the delay of the very first interaction when a user arrived on a page, completely ignoring processing time and all subsequent clicks.
INP is holistic: INP logs all user interactions throughout the entire lifespan of a page visit from initial load to page exit, and reports the worst single interaction delay (typically at the 75th percentile).
The INP Benchmark Thresholds
- Good: $\le 200$ milliseconds (Target threshold)
- Needs Improvement: Between 200ms and 500ms
- Poor: $> 500$ milliseconds
How INP Works: The 3 Phases of an Interaction
Every time a user clicks a button, expands a menu, or types into an input field, the browser executes three distinct phases:
- Input Delay: Waiting for main thread tasks to clear before processing starts.
- Processing Time: Running the JavaScript event handlers associated with the user action.
- Presentation Delay: Calculating layout geometry and painting the updated pixels onto the screen.
Main Thread Blocking & Long Tasks
The primary reason pages feel “frozen” or laggy is Main Thread contention.
Browsers execute code on a single thread (the Main Thread). If a heavy JavaScript script is running a Long Task (any continuous task lasting longer than 50ms), the browser cannot handle user inputs. The user taps a button, but nothing happens until that heavy background script finishes, leading to a poor INP score.
Cumulative Layout Shift (CLS): Measuring Visual Stability
What is CLS?
Cumulative Layout Shift (CLS) measures visual stability by tracking unexpected layout shifts that occur while a user is reading or navigating a page.
Real-World Analogy: The “Jumping Button”
Think of reading a news article on your phone. You go to tap a link, but right as your finger lands, an unoptimized ad unit pops into view above the text. The text jumps downward, causing your finger to accidentally click an unwanted ad.
CLS is the exact metric built to quantify and eliminate this frustrating user experience.
The CLS Benchmark Thresholds
Unlike LCP and INP (which are measured in time), CLS is a unitless mathematical score calculated by multiplying the fraction of the screen that shifted (Impact Fraction) by the distance the elements moved (Distance Fraction).
Layout Shift Score = Impact Fraction x Distance Fraction
- Good: $\le 0.1$ (Target threshold)
- Needs Improvement: Between 0.1 and 0.25
- Poor: $> 0.25$
Common Causes of Unexpected DOM Shifts
Elements shift unexpectedly on screen due to missing dimensional boundaries or dynamic content injection:
- Images Without Dimensions: HTML
<img>tags missing explicitwidthandheightattributes, causing the browser to render them at $0\times0$ pixels before snapping to full size once downloaded. - Ads, Embeds, and Iframes: Dynamic ad networks (like Google AdSense) injecting ads into unreserved layout spaces.
- Late-Injected Web Fonts: Custom fonts causing text to render invisible first (FOIT) or jump in size once loaded (FOUT).
- Dynamic UI Elements: Cookie banners, newsletter popups, or notification bars dynamically prepended to the top of the DOM.
Field Data vs. Lab Data - The Fundamental Divide
Have you ever run a test on Google PageSpeed Insights, scored a glowing 95/100 in green, only to open Google Search Console a few days later and find a warning stating your pages are failing Core Web Vitals?
This disconnect causes immense confusion for site owners, developers, and SEOs alike.
To understand why this happens, you must recognize that Google evaluates web performance using two completely different datasets: Lab Data and Field Data.
Field Data vs. Lab Data: Why PageSpeed Insights Scores Can Be Misleading
What is Field Data?
Field Data also known as Real User Monitoring (RUM), consists of actual performance metrics collected from real human visitors interacting with your website in the wild.
Every time a real user visits your site on a mobile phone or desktop computer using the Google Chrome browser, Chrome anonymously logs how fast the page loaded, how quickly it reacted to taps, and whether the layout shifted.
How Google Evaluates Field Data: The 75th Percentile (p75)
Google does not judge your site based on an average or best-case scenario. Instead, Google evaluates your Field Data at the 75th percentile (p75) across a rolling 28-day aggregation window.
What does the 75th percentile?
- It means that 75% of all real user visits to that specific page (or group of pages) must meet Google’s “Good” threshold for the page to pass.
- If 74% of your visitors have a fast load time, but 26% experience lag (due to slow 4G networks, older devices, or heavy ads), your page fails the Core Web Vitals assessment.
The SEO Reality: Field Data is the ONLY dataset Google uses for organic ranking evaluation. Google’s ranking algorithms evaluate real human experience, not synthetic lab scores.
What is Lab Data?
Lab Data is performance data collected within a controlled, synthetic environment using automated tools like Google Lighthouse.
When you click “Analyze” in PageSpeed Insights, Google spins up a simulated server instance, emulates a standardized mobile device (typically a mid-tier Moto G4 on a throttled 4G network connection), and runs a single test script to measure performance under fixed conditions.
The Purpose of Lab Data
Lab Data is designed for debugging during development. It provides a controlled baseline so developers can test code changes locally without waiting for real users to visit the site.
However, Lab Data has major limitations:
- No real user interaction: Lab tests cannot replicate how a real person scrolls, taps accordion menus, or types into form fields, which is why Lab tools cannot measure INP (Interaction to Next Paint) accurately.
- Controlled device specs: A lab test does not account for visitors using high-end iPhones on 5G or budget smartphones on congested 3G networks.
The Chrome User Experience Report (CrUX) Explained
Where does Google store and aggregate all this real-user Field Data? Inside the Chrome User Experience Report (CrUX).
CrUX is a public dataset maintained by Google that logs user experience metrics from millions of websites across the web.
Key Mechanics of CrUX:
- Opt-in Users: Data is gathered from Chrome users who have enabled sync and usage statistic sharing.
- Traffic Eligibility Thresholds: If your website receives very low traffic, Google may not have enough data points to generate a CrUX report for individual URLs. In these cases, Google aggregates data across your entire origin domain.
- 28-Day Latency: Because CrUX aggregates data over a 28-day window, fixing a technical issue today will not instantly green-light your Search Console reports. You must wait for the 28-day rolling window to clear old data.
Why Your Site Passes Lighthouse But Fails Google Search Console
Now we arrive at the core mystery: Why do synthetic Lighthouse scores mismatch real-world Search Console reports?
Here is a side-by-side technical breakdown of why this divide occurs:
| Comparison Attribute | Lab Data (Lighthouse) | Field Data (CrUX / Search Console) |
| Data Source | Single simulated bot test | Thousands of real human visits |
| Network Conditions | Standardized, throttled 4G | Real-world Wi-Fi, 5G, 4G, and slow 3G |
| Device Performance | Simulated mid-tier phone | Mix of high-end flagships & cheap devices |
| Interactivity Scope | Estimated during page load | Full lifetime of interaction (Measures INP) |
| Personalization / Ads | Renders static default page | Renders geo-targeted ads & personalized scripts |
| Impact on Google SEO | Zero Direct Impact (Debug tool only) | Direct Ranking Signal (Dictates CWV pass/fail) |
The 3 Most Common Reasons for the Score Disconnect:
- Third-Party Script & Ad Delays: In a clean Lab test, dynamic third-party ad networks or chat widgets may not fully fire or personalize. In the real world, dynamic ads load late, cause DOM layout shifts (CLS), and block the main thread for real users.
- Geographic & Network Diversity: Your local developer machine on gigabit fiber might score 99/100 in Lighthouse. However, if your actual target audience visits from areas with high network latency, their real-world LCP will fail in CrUX.
- INP Cannot Be Measured in the Lab: Lighthouse can measure Total Blocking Time (TBT) as a proxy, but it cannot measure true INP because a synthetic bot does not click through menus, expand FAQs, or submit forms like a real human.
What is Time to First Byte (TTFB) - The Foundation Layer
Before a browser can paint a single pixel of your webpage, construct a Document Object Model (DOM), or download a heavy hero image, it must make a request to your web server and wait for the very first piece of data to arrive.
That waiting period is known as Time to First Byte (TTFB).
While the previous sections focused on client-side user experience metrics (LCP, INP, and CLS), TTFB is the invisible backend foundation that dictates how quickly your entire performance engine can even start running. If your server is slow, your entire page setup is locked in traffic before it leaves the gate.
How Time to First Byte (TTFB) Limits Core Web Vitals
Why LCP Cannot Pass Without a Healthy TTFB (The Dependency Chain)
Many webmasters wonder why their Largest Contentful Paint (LCP) remains in the “Poor” category even after aggressively compressing hero images, minifying CSS, and implementing cutting-edge lazy loading.
The answer lies in the critical request dependency chain:
[ User Browser Request ] ──► [ TTFB (Server Processing & Response) ] ──► [ HTML Document Arrives ] ──► [ Resource Discovery & Fetch ] ──► [ LCP Render ]
- The Handshake: A user clicks a link to your site. Their browser sends an HTTP request to your origin server.
- The Wait (TTFB): Your server must look up DNS records, complete the SSL/TLS handshake, execute server-side code (like PHP or Node.js), query the database, and spit out the initial HTML response. This total duration is your TTFB.
- The Bottleneck: Until that very first HTML byte arrives at the browser, the browser doesn’t even know what files, images, or stylesheets exist on the page.
If your TTFB takes 2.0 seconds, your browser cannot even begin downloading your LCP hero image until those 2.0 seconds have elapsed. Because Google mandates that an optimal LCP must occur within 2.5 seconds total, a slow TTFB instantly destroys any chance of passing Core Web Vitals, no matter how fast your frontend code is.
Server Latency Benchmarks (Target: Under 800ms)
Google categorizes server response speeds based on real-world delivery thresholds:
- Good (Optimized): <= 800 milliseconds (The server delivers the initial response fast enough to leave a healthy window for browser rendering and LCP execution).
- Needs Improvement: Between 800ms and 1.8 seconds.
- Poor (Server Bottleneck): > 1.8 seconds (A severe server lag that makes passing Core Web Vitals practically impossible).
Measuring & Auditing Core Web Vitals
When you are responsible for an enterprise website or a growing e-commerce store with thousands of product pages, you cannot check your speed page-by-page. You need a systematic, repeatable audit pipeline.
Measuring performance effectively requires moving from macro-level user data down to micro-level code diagnostics. Let’s walk through the exact audit toolchain used by professional technical SEOs to find, diagnose, and fix performance bottlenecks across large site architectures.
How to Measure and Audit Core Web Vitals Across Your Site
Google Search Console Core Web Vitals Report (Grouped URL Diagnostics)
Google Search Console (GSC) is your macro-level command center for real-world user data.
Instead of showing you isolated test results, GSC groups your website’s URLs into structural template clusters (e.g., Product Detail Pages, Blog Posts, Category Archives) and reports how real users experience them.
- How to read GSC reports: Look past individual URLs. GSC flags issues by status (Poor, Needs Improvement, or Good) and groups them by root template cause (e.g., “LCP issue: longer than 2.5s (mobile)” affecting 450 distinct URLs).
- Finding URL Clusters: If a template-level issue is flagged, fixing the underlying theme template or page layout fixes all 450 URLs simultaneously.
- Tracking the 28-Day Validation Cycle: Once developers push a fix live, you click “Validate Fix” in GSC. Google initiates a strict re-evaluation period. Because CrUX relies on a rolling 28-day user window, it can take up to 4 weeks for GSC to officially shift a URL group from “Failed” to “Passed.”
PageSpeed Insights & Web.dev (URL-Level Breakdown)
Once Google Search Console points you toward a problematic URL cluster, you drop down to the URL level using PageSpeed Insights (PSI) (powered by the PageSpeed API and Lighthouse).
- Field Data vs. Lab Data Integration: PSI is unique because it displays both datasets at the top of the report. It shows the 28-day mobile/desktop CrUX field data for that specific URL alongside the simulated synthetic lab diagnostics.
- The Diagnostics Waterfall: PSI gives you a prioritized checklist under the “Opportunities” and “Diagnostics” tabs, estimating exactly how many seconds or kilobytes you will save by fixing specific render-blocking scripts or oversized images.
Chrome DevTools Performance Panel & Web Vitals Extension
When you need to debug a problem locally on your machine during development, you use Chrome DevTools.
- The Web Vitals Extension: A lightweight browser extension that overlays a live HUD (Heads-Up Display) in the corner of your browser window, showing real-time LCP, INP, and CLS scores as you click and scroll through your staging site.
- The Performance Panel: For advanced debugging, you record a session in the DevTools Performance tab. It generates a detailed flame chart showing every millisecond of Main Thread activity, helping developers pinpoint exact scripts causing Long Tasks (>50ms) that ruin INP.
Real User Monitoring (RUM) Tools for Enterprise Auditing
While Google Search Console and CrUX are free and essential, they have a major limitation: they only report data for pages with high search traffic. If you have thousands of long-tail pages with low traffic, Google’s public CrUX database will show “Insufficient Data.”
For enterprise sites, technical SEOs implement Real User Monitoring (RUM) tools (such as Cloudflare Web Analytics, New Relic, Datadog, or SpeedCurve).
- RUM scripts run directly in your visitors’ browsers, capturing 100% of performance telemetry across every single page on your domain in real-time.
- This allows enterprise engineering teams to catch regressions instantly rather than waiting weeks for Google’s public reporting cycles.
The Audit Pipeline: How to Identify Core Web Vitals Issues Across Platforms
Having the tools is only half the battle; you need a structured workflow to trace an issue from high-level discovery down to code execution.
Macro Level: Google Search Console CWV Report & Enterprise Crawlers (Ahrefs / SEMrush)
- Step 1: Open GSC to identify which templates (Mobile vs. Desktop) are failing.
- Step 2: Run a technical site crawl using tools like Ahrefs, SEMrush, or Screaming Frog, filtering for pages with massive HTML response sizes, excessive DOM depth, or broken resource links.
Micro Level: PageSpeed Insights & CrUX Field Data Analysis
- Step 3: Take representative sample URLs from your failing GSC clusters and run them through PageSpeed Insights to isolate whether the bottleneck is LCP, INP, or CLS.
Root Cause Diagnosis: Chrome DevTools Performance Panel & Coverage Tab
- Step 4: Inspect the network waterfall and coverage tab to catch unused JavaScript, unoptimized hero images, or layout-shifting elements.
- Step 5: Converting Data into Engineering Tickets: Translate technical audit findings into precise developer tasks (e.g., “Preload LCP hero image on
/shop/template” or “Defer third-party chat widget script to protect INP”).
How to Fix Core Web Vitals Issues?
We have unlocked the metrics, diagnosed the field-versus-lab divide, factored in server latency (TTFB), and built out a structured site audit pipeline. Now comes the ultimate execution phase: How do you actually fix Core Web Vitals?
In this section, we move from diagnosis to remediation, breaking down metric-specific fixes and showing how they are deployed across popular website architectures (WordPress, Shopify, and Modern Headless Stacks).
Remediation Strategy 1: Fixing Poor LCP
When a page fails Largest Contentful Paint (LCP), it usually means the browser takes too long to discover or download the main hero element.
Core Engineering Fixes:
- Eliminate Lazy-Loading on Hero Assets: Never apply
loading="lazy"to your above-the-fold LCP image or banner. Lazy loading tells the browser to wait until the image enters the viewport, adding unnecessary delay to the most important visual element on screen. - Preload Critical LCP Resources: Instruct the browser to download the LCP image immediately during initial HTML parsing by adding a preload link in your
<head>:
<link rel="preload" fetchpriority="high" as="image" href="/images/hero-banner.webp" type="image/webp">
- Prioritize Network Fetch: Use
fetchpriority="high"on your primary hero image tag so the browser prioritizes it over secondary banner images or footer graphics.
Remediation Strategy 2: Fixing Poor INP
If your Interaction to Next Paint (INP) score is poor, it means clicks, taps, or keystrokes are lagging because heavy JavaScript execution is choking the browser’s Main Thread.
Core Engineering Fixes:
- Break Up Long Tasks: Any JavaScript task that takes longer than 50 milliseconds blocks user input. Developers must break up monolithic scripts into smaller asynchronous chunks using techniques like
requestIdleCallback()or yielding control back to the main thread. - Defer Non-Essential Scripts: Move tracking pixels, chat widgets, and social media embeds out of the critical rendering path by using
deferorasyncattributes, or by loading them dynamically only after user interaction (e.g., on scroll or click). - Minimize JavaScript Execution Overhead: Remove unused third-party plugins, slim down heavy node modules, and audit your tag manager containers.
Remediation Strategy 3: Fixing Poor CLS
Cumulative Layout Shift happens when visual elements move unexpectedly after the page has started loading, frustrating users.
Core Engineering Fixes:
- Enforce Explicit Dimensions: Always declare explicit
widthandheightattributes (or CSS aspect-ratio boxes) on images, video wrappers, and dynamic container blocks so the browser reserves the exact pixel space before media assets finish downloading. - Reserve Ad & Embed Slots: Never inject dynamic ad banners or popups directly above existing content without allocating a fixed minimum height container beforehand.
- Control Web Font Loading: Prevent invisible text flashes (FOIT) or sudden text reflows (FOUT) by using
font-display: swapin your CSS font-face declarations.
The Platform Execution Matrix (Applying Remedies Across Web Stacks)
While the engineering rules above apply universally, how you implement them depends entirely on your web architecture. Here is how these remediation strategies translate across the three major web stacks:
| Web Stack / CMS | LCP Remediation Pathway | INP Remediation Pathway | CLS Remediation Pathway |
| WordPress Stack | • Use performance plugins (Perfmatters / WP Rocket) to exclude hero images from lazy-loading. • Add custom preloads via theme | • Clean up bloated page builders (Elementor/Divi JS overhead). • Defer unused plugin scripts using asset management tools. | • Ensure WordPress block editor images automatically output explicit width/height dimensions. • Set fixed heights for widget sidebars and ad units. |
| Shopify / E-Commerce Stack | • Optimize theme Liquid files to output native • Avoid oversized uncompressed banner images in slideshow sections. | • Audit and remove abandoned Shopify Apps injecting heavy JavaScript tracking into storefront headers. • Defer third-party chat and review widget scripts. | • Hardcode aspect ratios into product grid cards in theme CSS. • Reserve space for sticky header navigation and cart drawers to prevent layout jumping. |
| Custom Code / Headless Stack (Next.js / React) | • Utilize native framework components ( • Implement Server-Side Rendering (SSR) for instant HTML discovery. | • Use code-splitting and dynamic imports (next/dynamic) to load heavy interactive components only when needed. | • Framework image optimization naturally prevents layout shifts by locking intrinsic layout dimensions at compile time. |
How to Maintain Core Web Vitals Health Over Time
Achieving passing Core Web Vitals scores once is an accomplishment, but keeping them green permanently is an ongoing operational commitment. Because websites constantly evolve: developers push new code, marketers launch campaigns, and third-party vendors inject tracking scripts—performance can easily regress without continuous oversight.
In this final section, we explore the operational cycles required to maintain performance health, prevent regressions, and answer the most common searcher questions regarding Core Web Vitals.
The 28-Day CrUX Assessment Cycle & GSC Validation Protocol
When you fix a performance bottleneck on your website, you might expect Google Search Console to reflect your success immediately. However, because Google evaluates rankings based on the Chrome User Experience Report (CrUX) 28-day rolling window, progress takes time.
- The Validation Window: When you click “Validate Fix” in Google Search Console, Google initiates a monitoring cycle.
- The Waiting Game: It typically takes 2 to 4 weeks for real user traffic to accumulate enough new telemetry to overwrite the historical failing data in the 28-day rolling average.
- Patience is Key: Do not panic if your scores do not change overnight. Trust the engineering data, monitor real user monitoring (RUM) tools for instant feedback, and let Google’s background aggregators complete their cycle.
Preventing Performance Regression During Site Updates
To stop performance regressions from slipping into production, you must embed speed checks directly into your development workflow:
- Set Strict Performance Budgets: Define maximum file size limits for your web assets (e.g., maximum 150KB for JavaScript bundles, maximum 100KB for hero images). If a new code pull exceeds these budgets, the deployment build should fail automatically.
- Automated CI/CD Testing: Integrate tools like Lighthouse CI into your GitHub or deployment pipelines so that every code update is automatically tested for performance regressions before it ever goes live.
- Third-Party Script Audits: Regularly audit marketing pixels, chat widgets, and A/B testing tools. Unvetted third-party scripts are the #1 silent killer of both INP and LCP metrics.
Conclusion
Core Web Vitals have fundamentally transformed technical SEO. They bridge the gap between traditional search optimization and pure human-centric design. By treating performance not as a one-time audit task, but as an ongoing engineering discipline, you protect your rankings, boost user engagement, and drive higher conversions.
Need a Professional Technical SEO & Performance Audit?
If your website is struggling with stubborn Core Web Vitals failures, high TTFB server latency, or sluggish mobile rendering, I can help. Contact me for technical SEO practice or explore my Technical SEO Services & Mobile SEO Services.
Frequently Asked Questions
What are Core Web Vitals and why are they important?
Core Web Vitals (CWV) are a set of three specific web performance metrics defined by Google that evaluate real-world user experience on a webpage:
- Largest Contentful Paint (LCP): Measures loading speed (Target: $\le 2.5$ seconds).
- Interaction to Next Paint (INP): Measures real-time interactivity and responsiveness (Target: $\le 200$ milliseconds).
- Cumulative Layout Shift (CLS): Measures visual stability and layout jumping (Target: $\le 0.1$).
They are important because Google uses them as a direct page experience signal, and poor scores lead to higher bounce rates, frustrated users, and lower conversion rates.
Are Core Web Vitals a direct Google ranking factor?
Yes, Core Web Vitals directly affect SEO. Google officially incorporated Core Web Vitals into its Page Experience ranking system for both mobile and desktop search. They function primarily as a tie-breaker ranking factor: if two competing web pages offer equally authoritative and relevant content, Google will prioritize and rank the page that delivers superior Core Web Vitals performance.
How do you measure and check Core Web Vitals?
You can measure and check Core Web Vitals using both Google-native and third-party tools across two data layers:
- Field Data (Real User Monitoring): Check the Google Search Console (GSC) Core Web Vitals report or run a URL through PageSpeed Insights to view aggregated 28-day Chrome User Experience Report (CrUX) data from real human visitors.
- Lab Data (Synthetic Diagnostics): Use Chrome DevTools (Performance Panel), Lighthouse, or WebPageTest to simulate conditions and measure metrics locally during development.
How to fix and improve poor Core Web Vitals scores?
To fix and improve Core Web Vitals, apply metric-specific engineering remedies:
- To Fix LCP (Loading): Preload your main hero image, assign
fetchpriority="high", eliminateloading="lazy"on above-the-fold assets, and upgrade server TTFB latency. - To Fix INP (Responsiveness): Break up JavaScript Long Tasks (>50ms), yield control to the main thread, and defer non-essential third-party tracking scripts.
- To Fix CLS (Visual Stability): Declare explicit
widthandheightattributes on images and video embeds, reserve fixed aspect-ratio containers for dynamic ads, and usefont-display: swapfor web fonts.
What is the difference between LCP and FCP?
First Contentful Paint (FCP) measures the exact moment the browser renders the very first piece of DOM content (such as a background color, header text, or tiny logo). Largest Contentful Paint (LCP) measures when the main visual element above the fold (like your primary hero banner or H1 heading) finishes rendering. Google cares about LCP because users care about the main content, not just when the screen starts waking up.
Why did Google replace FID with INP?
First Input Delay (FID) only measured the delay of the very first click or tap a user made when arriving on a page, completely ignoring all subsequent interactions. Interaction to Next Paint (INP) tracks every single click, tap, and keyboard interaction throughout the entire lifespan of the page visit, reporting the worst interaction delay to give an accurate reflection of real-world responsiveness.
How often does the Chrome User Experience Report (CrUX) update?
The public CrUX dataset and Google Search Console performance reports operate on a 28-day rolling window. This means metrics represent an aggregated average of real user experiences collected over the preceding four weeks.
Can a website rank well on Google if it fails Core Web Vitals?
Yes, but only temporarily or if your content has zero meaningful competition. Core Web Vitals act as a tie-breaker ranking signal. If your content and backlink authority match a competitor’s, the site with better Core Web Vitals will win. Furthermore, failing CWV metrics increases bounce rates, which indirectly hurts long-term organic rankings.
Why do my PageSpeed Insights lab score and Search Console field data clash?
PageSpeed Insights lab data is a synthetic simulation run on a throttled mobile device in a controlled environment. Google Search Console field data is real-world telemetry collected from thousands of actual human visitors using diverse devices, networks, and geographic locations. Google ranks your site based on real-world field data, not lab scores.
Are Core Web Vitals a direct ranking factor for desktop search?
Yes. While mobile-first indexing dictates that Googlebot primarily crawls and evaluates your mobile version, Core Web Vitals thresholds apply across both mobile and desktop search results, each tracked as separate performance streams in Google Search Console.
How long does it take for Google Search Console to clear a “Failed” CWV status?
After you implement code fixes and click “Validate Fix” in Google Search Console, it typically takes 28 days (one full CrUX collection cycle) for Google to verify the fix and transition your URL group from “Failing” to “Passed.”
Explore Other Articles Under Technical SEO Side
Pillar Blogs
What is Technical SEO? (Parent Blog)
- Core Web Vitals & Technical Performance (Child Blog)